Statistics: Bivariate Data - Exploring Relationships & Patterns
Welcome to our learning module on bivariate data, where we’ll dive into the exciting world of data relationships and visual interpretation! Through engaging video instruction, we’ll uncover how to use scatter plots to explore connections between two numerical variables. You’ll learn how to identify patterns such as positive relationships (when one variable increases, the other also increases), negative relationships (when one variable increases, the other decreases), and instances where no correlation exists. Along the way, we’ll enhance our ability to spot outliers, gaps where no data points exist, and clusters where data points group together.
One of the highlights of this module is discovering the concept of the line of best fit—a tool mathematicians and scientists use to make predictions based on data. Together, we’ll define and draw this line on scatter plots, and then use it to predict future values. You’ll also interpret key components of the line: the slope, which describes how variables change in relation to one another, and the y-intercept, which reveals starting points in certain contexts. By the end of this lesson, you’ll feel confident not only identifying these features but also explaining what they mean in real-world scenarios.
Finally, we’ll expand our understanding by constructing and analyzing two-way tables, a method used to summarize relationships between two categorical variables. Using real-world examples, we’ll calculate relative frequencies for rows or columns and use this information to describe possible associations between variables. This skill will empower you to interpret data effectively, whether it’s survey responses, experimental results, or trends in everyday life. Get ready to become a data detective as we explore the patterns and stories hidden in numbers!


Scatter Plots Lesson
Lesson Objective: By the end of this lesson, students will be able to describe patterns in scatter plots and interpret scatter plots.
Essential Question: How can you use a scatter plot to show the relationship between two variables?

Check for Understanding: Test your understanding with these end-of-lesson practice problems to reinforce your skills and master the concept!
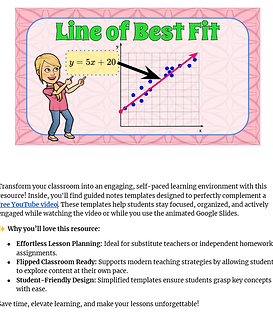
Line of Best Fit Lesson
Lesson Objective: By the end of the lesson, students will be able to identify a line of best fit and use a line of best fit to solve problems.
Essential Question: How can you use a line of best fit to predict an outcome on a scatter plot?
Check for Understanding: Test your understanding with these end-of-lesson practice problems to reinforce your skills and master the concept!
Two-Way Tables Lesson
Lesson Objective: By the end of the lesson, students will be able to read and interpret two-way tables, calculate the probability or relative frequency of a given outcome based on the data, and analyze the data to describe possible associations between two variables.
Essential Question: How can you use data from a two-way table to determine whether a relationship exists between two variables?

Check for Understanding: Test your understanding with these end-of-lesson practice problems to reinforce your skills and master the concept!